Debug a Single Test Case in VSCode
In a previous post, I explained how to debug JavaScript and TypeScript test files in VSCode. The previous solution focused on debugging an entire test file like something.test.js. In this post, I will show you how to debug a single test case within that test file.
We'll start with the launch.json file from the previous post. This file, located in the .vscode folder, allows us to launch the JavaScript debug terminal and run the npm run test command. The current file is appended to the executed command via the ${fileBasenameNoExtension} variable.
{
  "version": "0.2.0",
  "configurations": [
    {
      "type": "node-terminal",
      "name": "Debug Test File",
      "request": "launch",
      "command": "npm run test -- ${fileBasenameNoExtension}",
      "cwd": "${fileDirname}"
    }
  ]
}{
  "version": "0.2.0",
  "configurations": [
    {
      "type": "node-terminal",
      "name": "Debug Test File",
      "request": "launch",
      "command": "npm run test -- ${fileBasenameNoExtension}",
      "cwd": "${fileDirname}"
    }
  ]
}
This means that if we are currently editing the something.test.js file, we just need to set a breakpoint and start debugging. The CLI command executed will be npm run test -- something.test.js, and it will break at our breakpoint.
Now, if we have multiple test cases in this test file and want to debug a specific test case, we probably want to skip the others. Testing frameworks like Jest and others let us run test cases by name. For example, Jest has the --testNamePattern=<regex> CLI option to specify the test name. This works with plain strings and does not require a regular expression.
In addition to testing frameworks, VSCode has variables that we can use in the launch.json file. In particular, there is the ${selectedText} variable, which returns the currently selected text in the active file.
With these two options, we can create a CLI command that executes a single test case based on its name:
{
  "version": "0.2.0",
  "configurations": [
    {
      "type": "node-terminal",
      "name": "Debug Single Test",
      "request": "launch",
      "command": "npm run test -- ${fileBasenameNoExtension} -t=\"${selectedText}\"",
      "cwd": "${fileDirname}"
    }
  ]
}{
  "version": "0.2.0",
  "configurations": [
    {
      "type": "node-terminal",
      "name": "Debug Single Test",
      "request": "launch",
      "command": "npm run test -- ${fileBasenameNoExtension} -t=\"${selectedText}\"",
      "cwd": "${fileDirname}"
    }
  ]
}
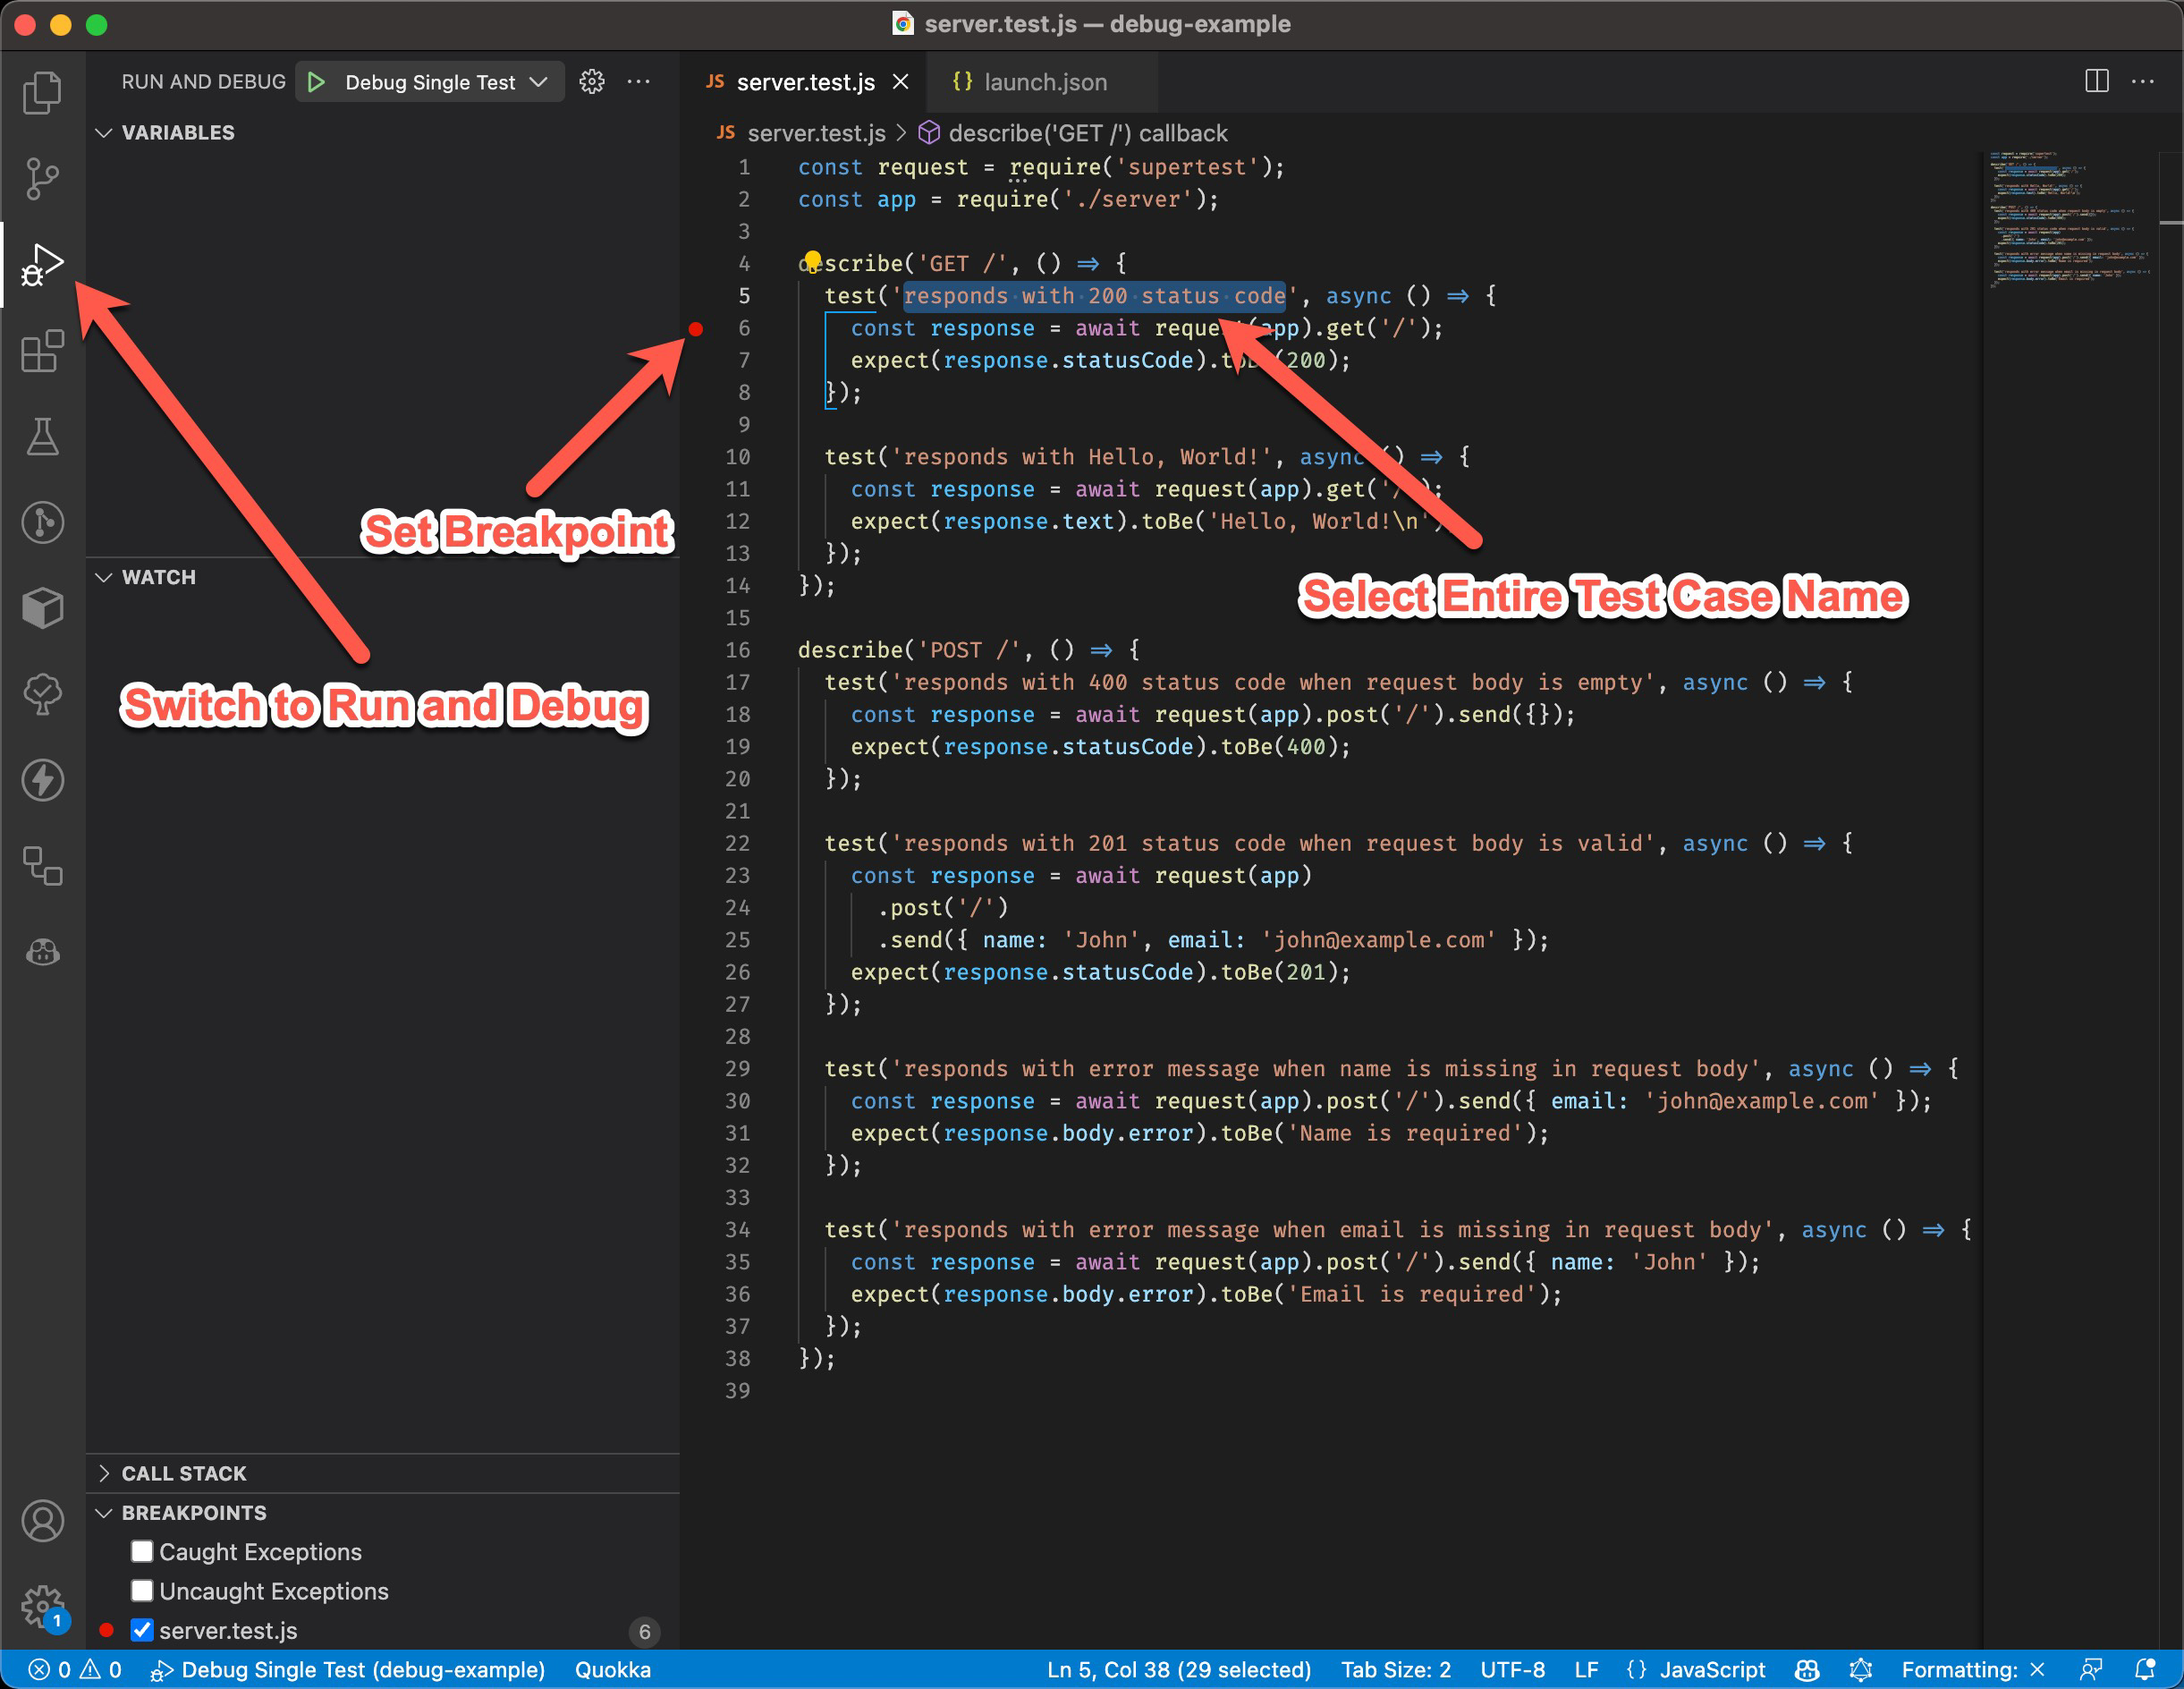
To test this, open a test file and set a breakpoint in your test case. Then, select the name of the test case and switch to the Run and Debug menu.

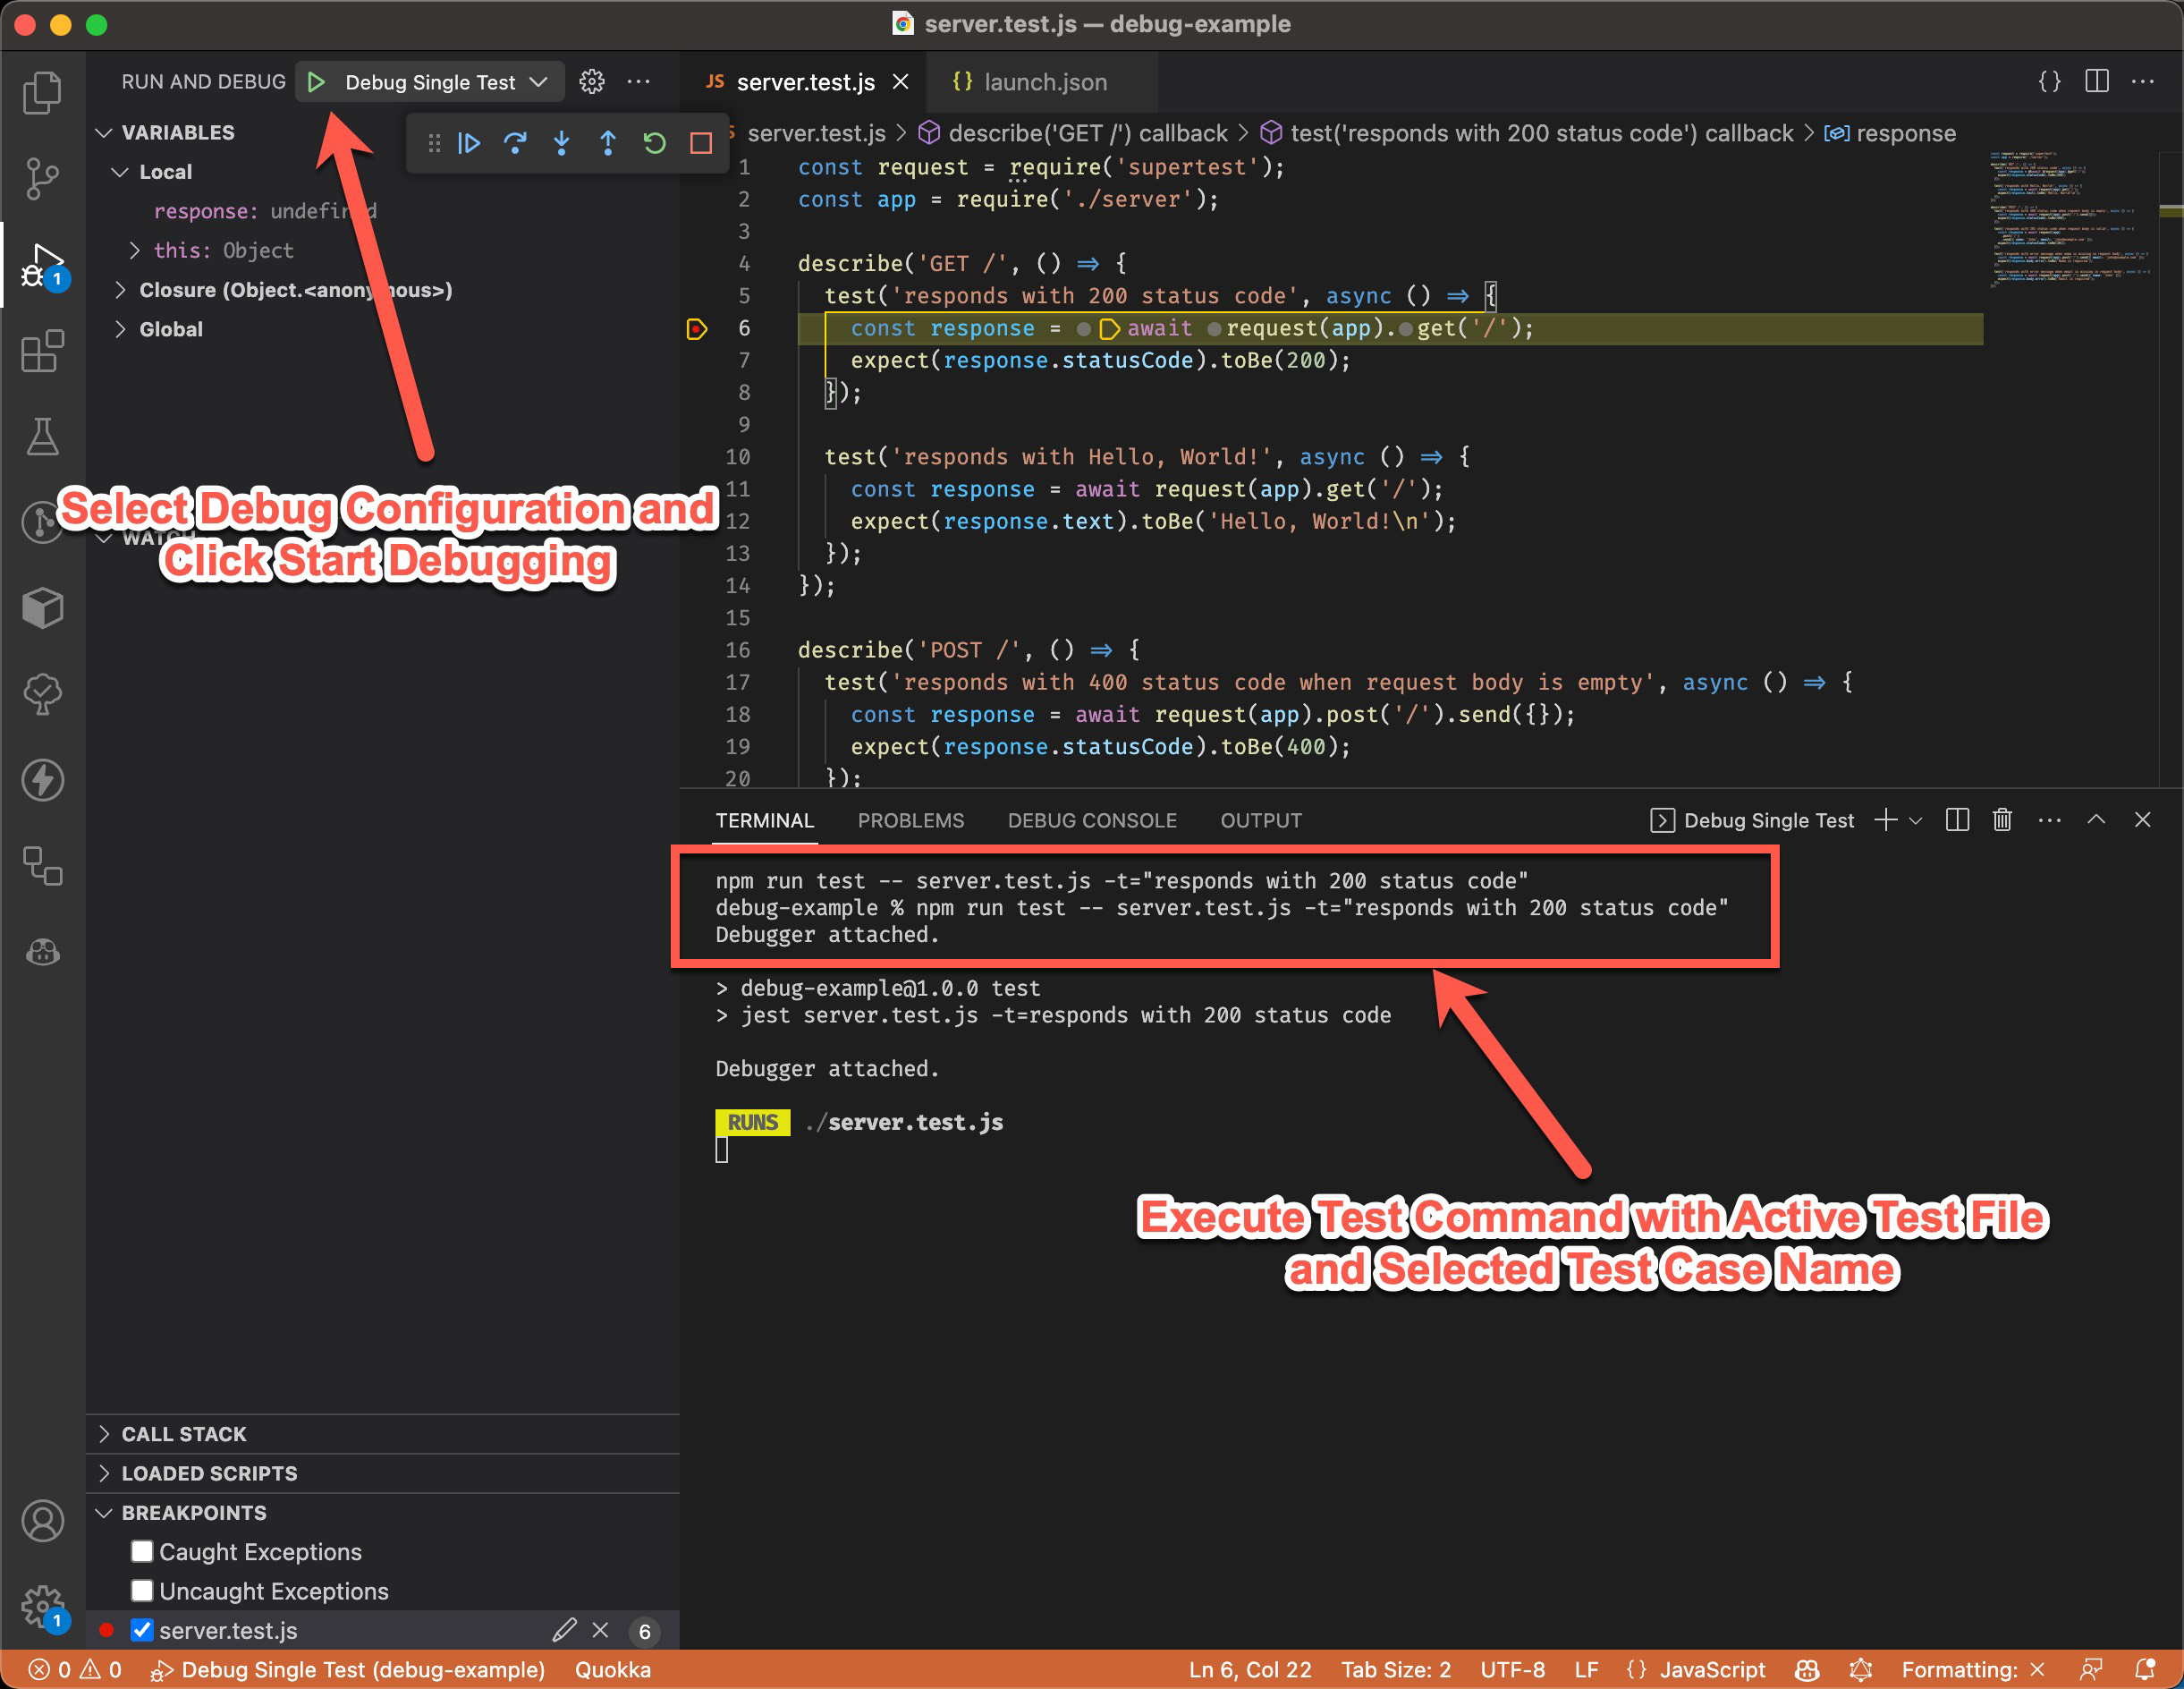
From the Run and Debug menu, select the debug configuration you created earlier and click Start Debugging. A new JavaScript debug terminal opens, and the CLI command is executed with the name of the test file and the currently selected test case.

If everything is configured correctly, the debugger should stop at your breakpoint. If you continue execution, the remaining test cases in the test file should be skipped.