Run and Debug JavaScript and TypeScript in VSCode
VSCode has some great debugging features. In a previous post, I already explained how easy it is to debug a React app using Chrome and VSCode. This time I'll focus on debugging a single JavaScript or TypeScript file.
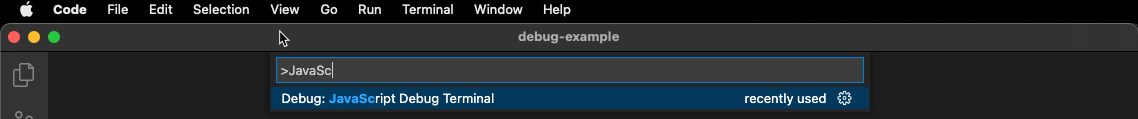
The typical way to debug a JS file is to use the JavaScript debug terminal. Such a terminal can be opened via the menu:
View → Command Palette → JavaScript Debug Terminal
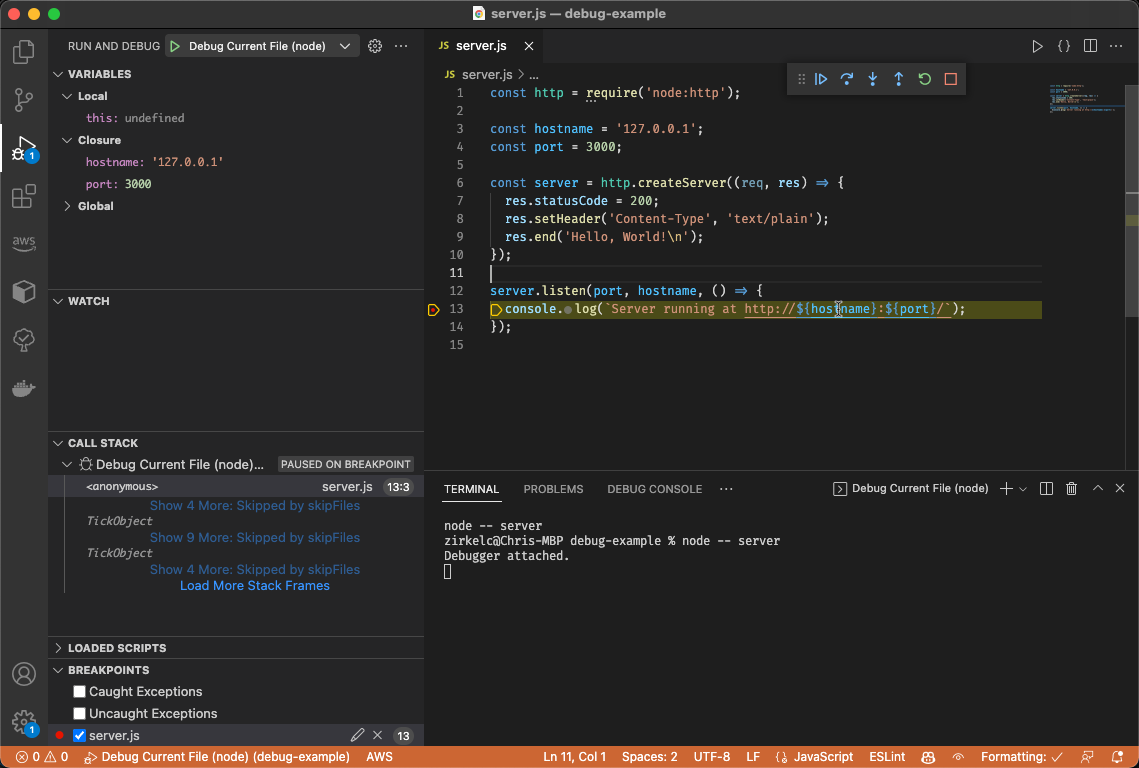
Simply set a breakpoint in your JS file and run the file you want to debug in the terminal, either directly by running node <file> or via a package script by running npm run <script>. The debug terminal automatically attaches to the starting Node.js process and stops at your breakpoints. This also works with TypeScript if you use ts-node <file>.
Debug Configurations
However, this process can be automated by creating debug configurations that open the JavaScript debug terminal and automatically execute the currently open JS or TS file with just one click. First, we need to create the .vscode folder in our workspace and then create the launch.json file in it. This file defines a list of options to run or debug the project.
{
  "version": "0.2.0",
  "configurations": [
    {
      "type": "node-terminal",
      "name": "Debug Current JS File (node)",
      "request": "launch",
      "command": "node -- ${fileBasenameNoExtension}",
      "cwd": "${fileDirname}"
    },
    {
      "type": "node-terminal",
      "name": "Debug Current TS File (ts-node)",
      "request": "launch",
      "command": "ts-node -- ${fileBasenameNoExtension}",
      "cwd": "${fileDirname}"
    },
    {
      "type": "node-terminal",
      "name": "Debug Current Test File (npm run test)",
      "request": "launch",
      "command": "npm run test -- ${fileBasenameNoExtension}",
      "cwd": "${fileDirname}"
    }
  ]
}{
  "version": "0.2.0",
  "configurations": [
    {
      "type": "node-terminal",
      "name": "Debug Current JS File (node)",
      "request": "launch",
      "command": "node -- ${fileBasenameNoExtension}",
      "cwd": "${fileDirname}"
    },
    {
      "type": "node-terminal",
      "name": "Debug Current TS File (ts-node)",
      "request": "launch",
      "command": "ts-node -- ${fileBasenameNoExtension}",
      "cwd": "${fileDirname}"
    },
    {
      "type": "node-terminal",
      "name": "Debug Current Test File (npm run test)",
      "request": "launch",
      "command": "npm run test -- ${fileBasenameNoExtension}",
      "cwd": "${fileDirname}"
    }
  ]
}
Let's briefly go through the anatomy of a configuration:
type: the configuration type, in this casenode-terminalto debug Node.js apps via the JavaScript Debug Terminal.name: the description of a configuration in the dropdown menu within the Run and Debug section.request: start a new debug session vialaunchor attach to an already running process viaattachcommand: the command on the terminal that will be executed when starting a new debug sessioncwd: the current working directory, i.e. in which folder the command is executed The main difference between the configurations is the command we run to start a debug session. If we are working with JavaScript, we can simply runnode. On the other hand, if we are working with TypeScript, we need to usets-nodeinstead. Furthermore, it is sometimes useful to run a predefined NPM script frompackage.json. This is especially useful for debugging test cases that need to be executed by a test library like Jest, Mocha, Karma, etc. In this case we can run thenpm run testscript.
Variables
The variables ${fileBasenameNoExtension} and ${fileDirname} are placeholders and will be replaced upon start. The following predefined variables are supported:
${userHome} - the path of the user's home folder
${workspaceFolder} - the path of the folder opened in VS Code
${workspaceFolderBasename} - the name of the folder opened in VS Code without any slashes (/)
${file} - the current opened file
${fileWorkspaceFolder} - the current opened file's workspace folder
${relativeFile} - the current opened file relative to workspaceFolder
${relativeFileDirname} - the current opened file's dirname relative to workspaceFolder
${fileBasename} - the current opened file's basename
${fileBasenameNoExtension} - the current opened file's basename with no file extension
${fileDirname} - the current opened file's dirname
${fileExtname} - the current opened file's extension
${cwd} - the task runner's current working directory upon the startup of VS Code
${lineNumber} - the current selected line number in the active file
${selectedText} - the current selected text in the active file
${execPath} - the path to the running VS Code executable
${defaultBuildTask} - the name of the default build task
${pathSeparator} - the character used by the operating system to separate components in file paths${userHome} - the path of the user's home folder
${workspaceFolder} - the path of the folder opened in VS Code
${workspaceFolderBasename} - the name of the folder opened in VS Code without any slashes (/)
${file} - the current opened file
${fileWorkspaceFolder} - the current opened file's workspace folder
${relativeFile} - the current opened file relative to workspaceFolder
${relativeFileDirname} - the current opened file's dirname relative to workspaceFolder
${fileBasename} - the current opened file's basename
${fileBasenameNoExtension} - the current opened file's basename with no file extension
${fileDirname} - the current opened file's dirname
${fileExtname} - the current opened file's extension
${cwd} - the task runner's current working directory upon the startup of VS Code
${lineNumber} - the current selected line number in the active file
${selectedText} - the current selected text in the active file
${execPath} - the path to the running VS Code executable
${defaultBuildTask} - the name of the default build task
${pathSeparator} - the character used by the operating system to separate components in file paths
The full variables reference is available on the VSCode documentation.
Run and Debug
Finally, let's try it out. Open the Run and Debug section in the left sidebar and choose one of the configurations we just created, depending on which file you want to debug. I quickly grabbed a sample server script from Node.js. Then set your breakpoint and click the Run icon at the top to start the debug session.