How To Debug a React App in VSCode
When developing a React app (or any JavaScript app), I heavily use console.log() for debugging purposes if something is not running as expected. Only if it's really tricky, I use the VSCode debugger. It's not that I don't like debuggers, debugging JS is just not as convenient as it is in other programming languages.
Problem
Usually, the React app is started with npm run start/yarn start (react-scripts start) and it runs on localhost:3000 and hot reloads when making file changes. A new Chrome tab is opened by React and I just keep this tab open forever. If I need to check the value of a certain variable, I log it to the console and check the output on Chrome Dev Tools.
On the other hand, VSCode offers two debugging options for JS apps: Launching the debugger with a new browser window or attaching the debugger to the already running app on a certain browser window/tab. Until now, I was only using the first option of launching a new window because I wasn't able to get the second option working. Unfortunately, launching a new browser means you have to navigate to the page you actually want to debug and you lose all your state (e.g. form inputs). So effectively you end up with two instances of the same app. And that's the reason I didn't use the debugger in the first place.

However, I didn't want to accept that issue any longer and decided to figure out what I'm missing. Here are my findings!
Start React App with Remote Debugging
In order to debug JS apps, the browser has to be started with remote debugging enabled. For example, Chrome has to be started with the flag --remote-debugging-port=9222. When you click debug on VSCode it does exactly that: It starts a new browser window with this command line argument. Unfortunately, the default React start script launches a browser without remote debugging (maybe for safety reasons?).
However, the advanced configuration allows us to change the browser and how it is launched by setting two environment variables BROWSER and BROWSER_ARGS:
"scripts": {
    "start": "BROWSER='google chrome' BROWSER_ARGS='--remote-debugging-port=9222' react-scripts start",
    ...
}
The name of the browser depends on the operating system. For example, Chrome is google chrome on macOS, google-chrome on Linux and chrome on Windows.
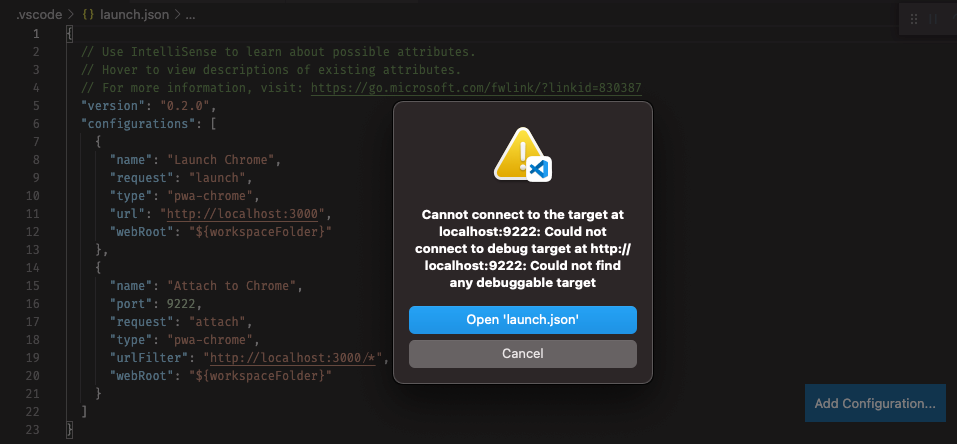
You have to close Chrome completely before running this script. If Chrome is already running on your system, this React start script will not create a new window but will create a new tab on your existing Chrome window. My assumption is that you enable remote debugging on process level and if you already started Chrome by clicking on the icon, remote debugging is not enabled by default. Then, when React wants to launch a new window, Chrome internally checks if it can use an existing window or if it has to create a new window. In my case, it re-used the existing Chrome window and didn't enable remote debugging. I guess that's also the reason I was not able to attach the VSCode debugger to my running React app.
Start Chrome Always with Remote Debugging
Another more convenient option is to start Chrome always with remote debugging enabled. On Windows it's straightforward as you just have to right-click on the Chrome shortcut, go to properties and append the above command line argument to the target field like this: C:\\Program Files (x86)\\Google\\Chrome\\Application\\chrome.exe --remote-debugging-port=9222 -- "%1"
On macOS it's trickier. I've found two options on the Internet that I will include in the following. In both cases you end up with a new Chrome app that you can add to the dock to replace the original app. It's a kind of shortcut that will simply start Chrome with command line arguments.
Create a Custom Chrome App
This answer on StackOverflow describes how to create a custom Chrome app only with a text editor. It also includes a nice debug icon that you can use to distinguish the custom app from the original app.
Using Automator
There's another solution by Dave Shepard on how to use Automator to create a custom Chrome app. Automator is a macOS standard tool to create apps and workflows composed of multiple actions. In my case, I created an app that runs a shell script to start Chrome with remote debugging enabled. Please refer to the original blog post for detailed instructions.
Debugging in VSCode
Now that we have Chrome up and running with remote debugging enabled, we can head back to VSCode for debugging the React app. VSCode manages its debug configurations in the file .vscode/launch.json:
{
	// Use IntelliSense to learn about possible attributes.
	// Hover to view descriptions of existing attributes.
	// For more information, visit: <https://go.microsoft.com/fwlink/?linkid=830387>
	"version": "0.2.0",
	"configurations": [
		{
			"name": "Launch Chrome",
			"request": "launch",
			"type": "pwa-chrome",
			"url": "<http://localhost:3000>",
			"webRoot": "${workspaceFolder}"
		},
		{
			"name": "Attach to Chrome",
			"port": 9222,
			"request": "attach",
			"type": "pwa-chrome",
			"urlFilter": "<http://localhost:3000/*>", // use urlFilter instead of url!
			"webRoot": "${workspaceFolder}"
		}
	]
}
There are two debug configurations. The first will create a new Chrome window with remote debugging enabled on the url http://localhost:3000, while the second will attach the debugger to an existing Chrome window. The important things I'd like to mention here are the port and the urlFilter properties. The port number must match the remote debugging port from the command line argument above (it's not the port on which the development server runs, e.g. 3000). The url filter expression will search for a page with this url.
In VSCode we can simply put a breakpoint in our component which is currently being rendered in the browser and then click debug Attach to Chrome. The breakpoint will break on the next re-render of the component and we don't have to navigate on a new browser window.